Monitoring and Logging
This section covers how to monitor the behaviour and performance of your validator once deployed.
Monitoring
The validator deployment includes a complete monitoring stack:
- Prometheus: Metrics collection (port 9090)
- Grafana: Visualization dashboards (port 3000)
- Watchtower: Automatic container updates (checks every 30 seconds)
Accessing Grafana
- Open your browser to
http://your-server-ip:3000 - Default credentials:
- Username:
admin - Password:
admin(you'll be prompted to change it)
- Username:
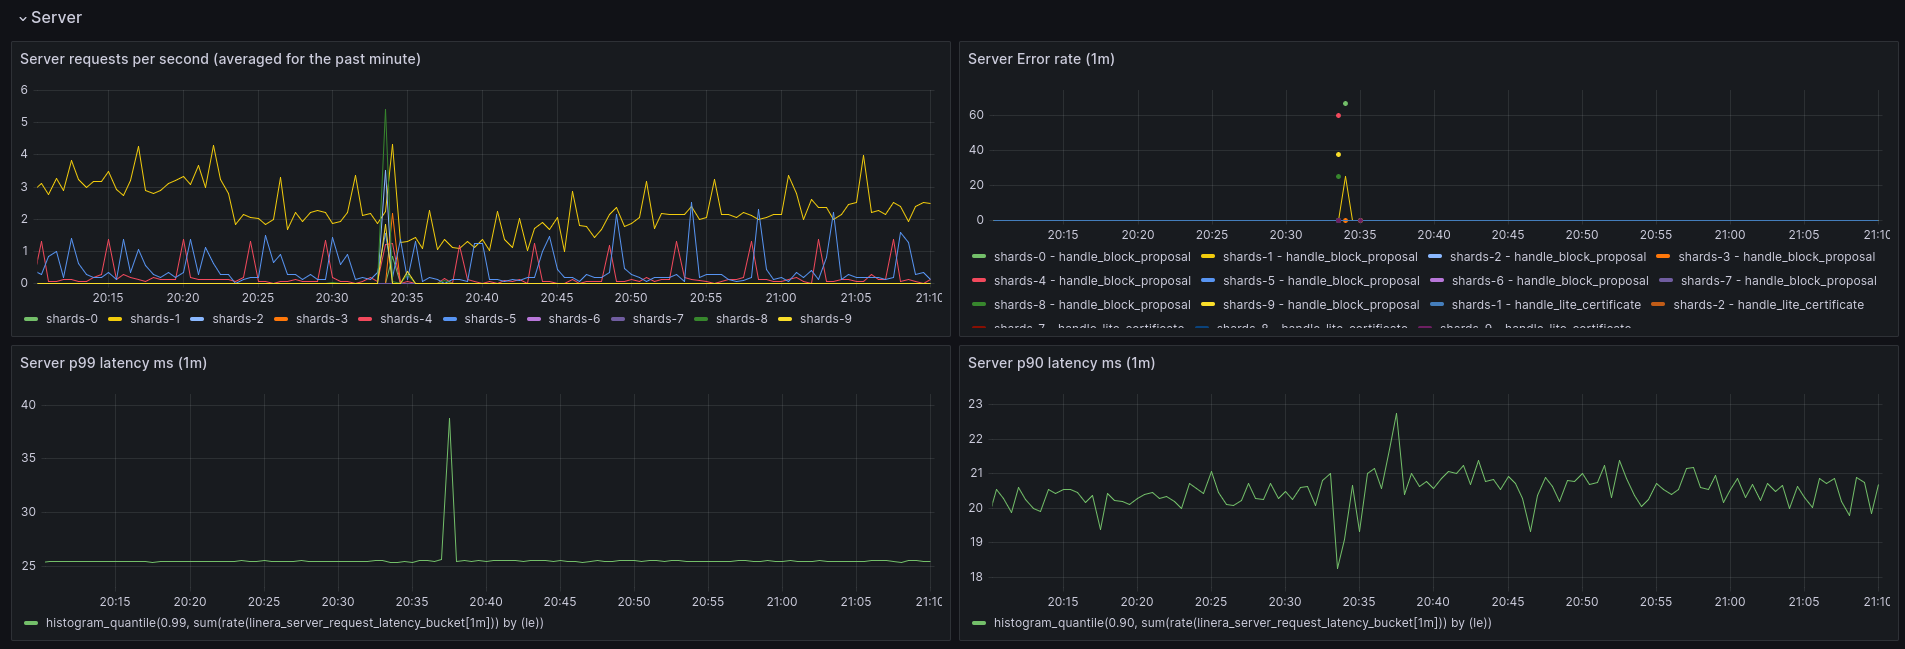
- Navigate to the "General" dashboard for validator metrics
The dashboard displays:
- Request latency percentiles
- Error rates
- Throughput metrics
- Resource utilization
Available Services and Ports
| Service | Port | Purpose |
|---|---|---|
| Caddy (web) | 80, 443 | SSL/TLS termination and reverse proxy |
| Grafana | 3000 | Monitoring dashboards |
| Prometheus | 9090 | Metrics collection |
| Proxy | 19100 | Internal validator proxy (not exposed externally) |
| ScyllaDB | 9042 | Database (internal only) |
Logging
Logging is handled by Docker Compose, capturing stdout/stderr from all services.
Viewing Logs
# View all logs
docker compose logs

# View logs for specific service
docker compose logs web          # Caddy web server
docker compose logs proxy        # Validator proxy
docker compose logs scylla       # ScyllaDB
docker compose logs shard        # Validator shards (all replicas)

# Follow logs in real-time
docker compose logs -f

# View last 100 lines
docker compose logs --tail=100

# View logs for multiple services
docker compose logs web proxy

# View logs with timestamps
docker compose logs -t
Common Log Checks
# Check SSL certificate status
docker compose logs web | grep -i "certificate"

# Check for errors
docker compose logs | grep -i error

# Check ScyllaDB initialization
docker compose logs scylla | grep -i "started"

# Monitor shard health
docker compose logs shard | grep -i "health"
Log Rotation
Docker automatically rotates logs. To configure log rotation, add to your
docker-compose.yml:
services:
  proxy:
    logging:
      driver: 'json-file'
      options:
        max-size: '100m'
        max-file: '10'